
iMapGenes: An Anthropocene map of genetic diversity
Understanding what determines biodiversity is a major scientific challenge for the 21st century, especially in the light of global change.
Biodiversity encompasses diversity at all levels of biological organization, from genetic diversity within populations, to species diversity within communities and the diversity of ecosystems in a landscape. However, most of the studies to date on the global patterns of Biodiversity have been conducted at the species and ecosystem diversity levels.
Any use of maps, figures and pictures of the article must be credited Journal Science / AAAS.
Our study
Our global map of genetic biodiversity is published in Science and free access is available to the abstract, full text reprint and full text online.
See the short video presentation of our study or read more below:
Method
To be able to produce the map, we took advantage of the immense wealth of publicly available genetic sequences in GenBank and BOLD Systems repositories.
We then developed bioinformatic tools to attach geographic coordinates to a total of 92,801 mitochondrial sequences (31,029 for amphibians and 61,772 for terrestrial mammals) and adapted a widely-used genetic diversity metric, nucleotide diversity, to explore how this diversity is distributed across the globe.
Results
The study shows that genetic diversity is generally higher in the tropics (i.e., tropical Andes, Amazonia and the tropics of East Asia) than in higher latitudes, a pattern that follows the global pattern of species richness. It also shows that areas more impacted by humans, as urban areas and croplands, have reduced genetic diversity when compared to wilder regions - a pattern that is especially evident in amphibians.
Data
We provide all data we used in our analyses, including species name, coordinates, accession number, etc.
Citation
Andreia Miraldo, Sen Li, Michael K. Borregaard, Alexander Flórez-Rodríguez, Shyam Gopalakrishnan, Mirnesa Rizvanovic, Zhiheng Wang, Carsten Rahbek, Katharine A. Marske & David Nogués-Bravo (2016): An Anthroppocene map of genetic diversity. Science 353 (6307), p1532-1535, published online on September 30th, 2016. DOI: 10.1126/science.aaf4381.
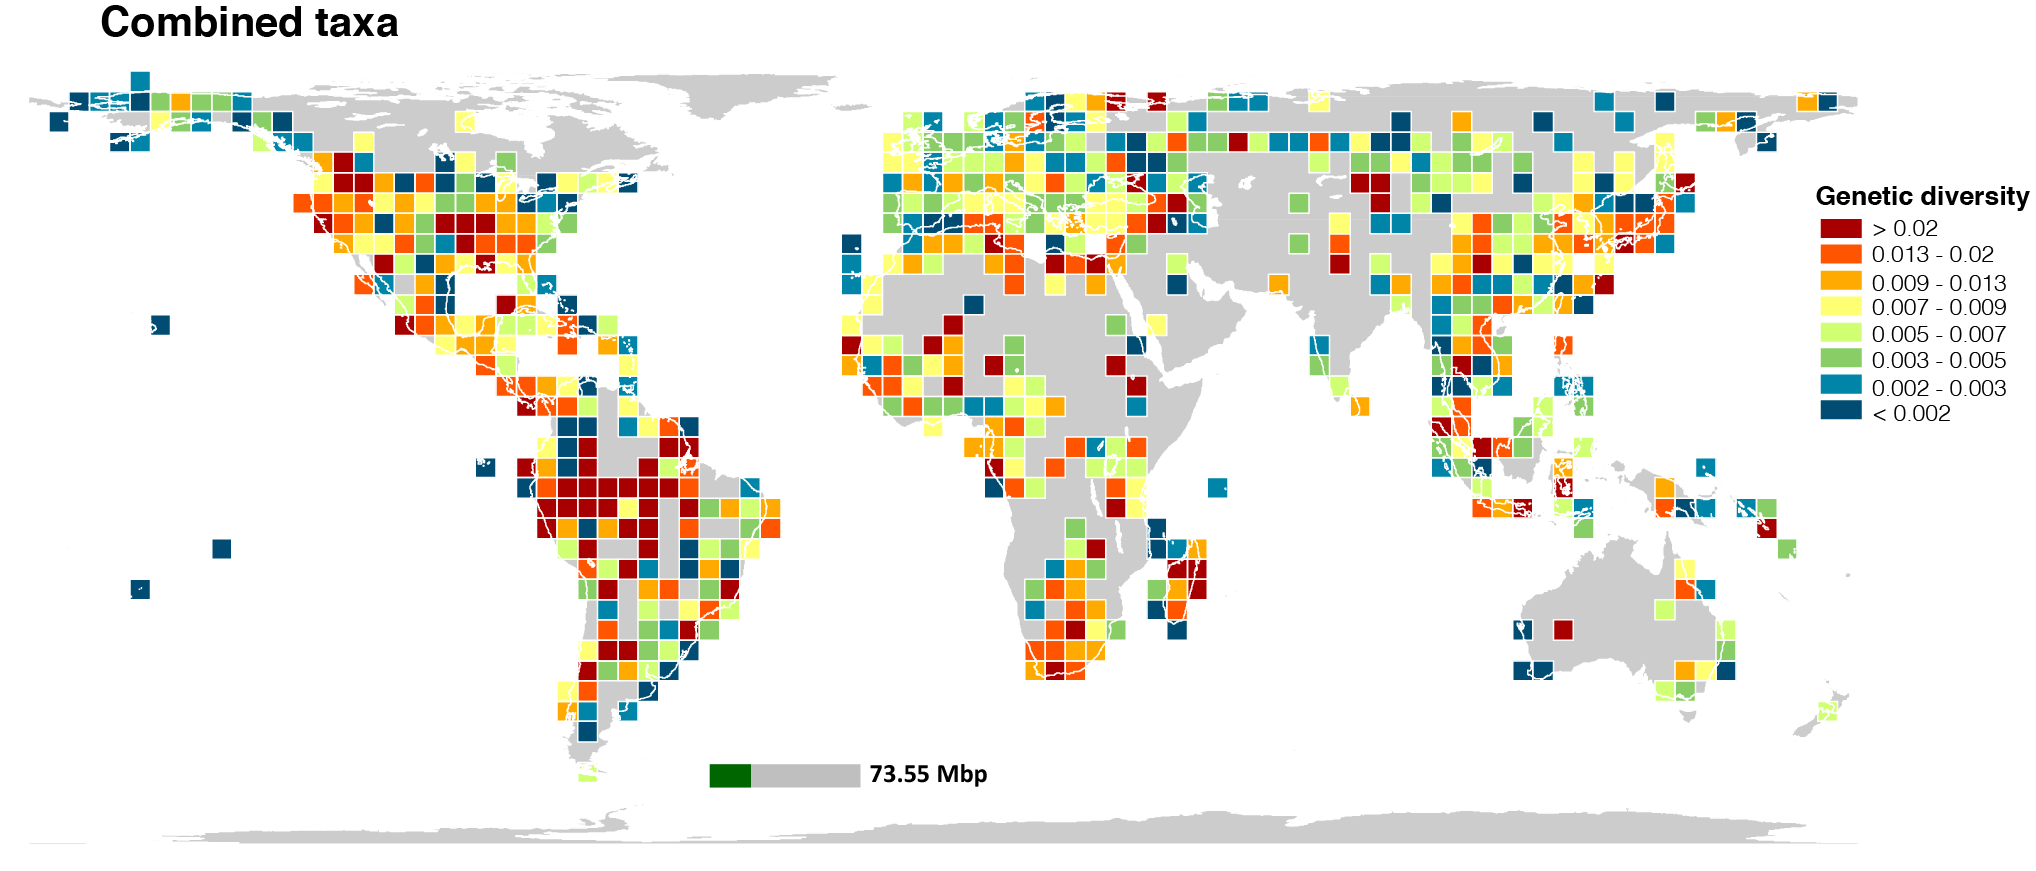
A global distribution map of genetic diversity for combined taxa of amphibians and terrestrial mammals. Any use of the map must be credited Journal Science / AAAS. Image: Miraldo et al. 2016.